Source: examples/streamlit
Streamlit + SkyPilot#
Deploy your Streamlit app with SkyPilot.
Quick start#
Launch the app using streamlit.sky.yaml:
sky launch -c streamlit-app streamlit.sky.yaml # specify "--infra aws" or other cloud if desired
Tip: Add
-dto detach and return to your terminal immediately:sky launch -c streamlit-app streamlit.sky.yaml -d
Get the endpoint URL:
ENDPOINT=$(sky status --endpoint 8501 streamlit-app)
echo "Streamlit app: $ENDPOINT"
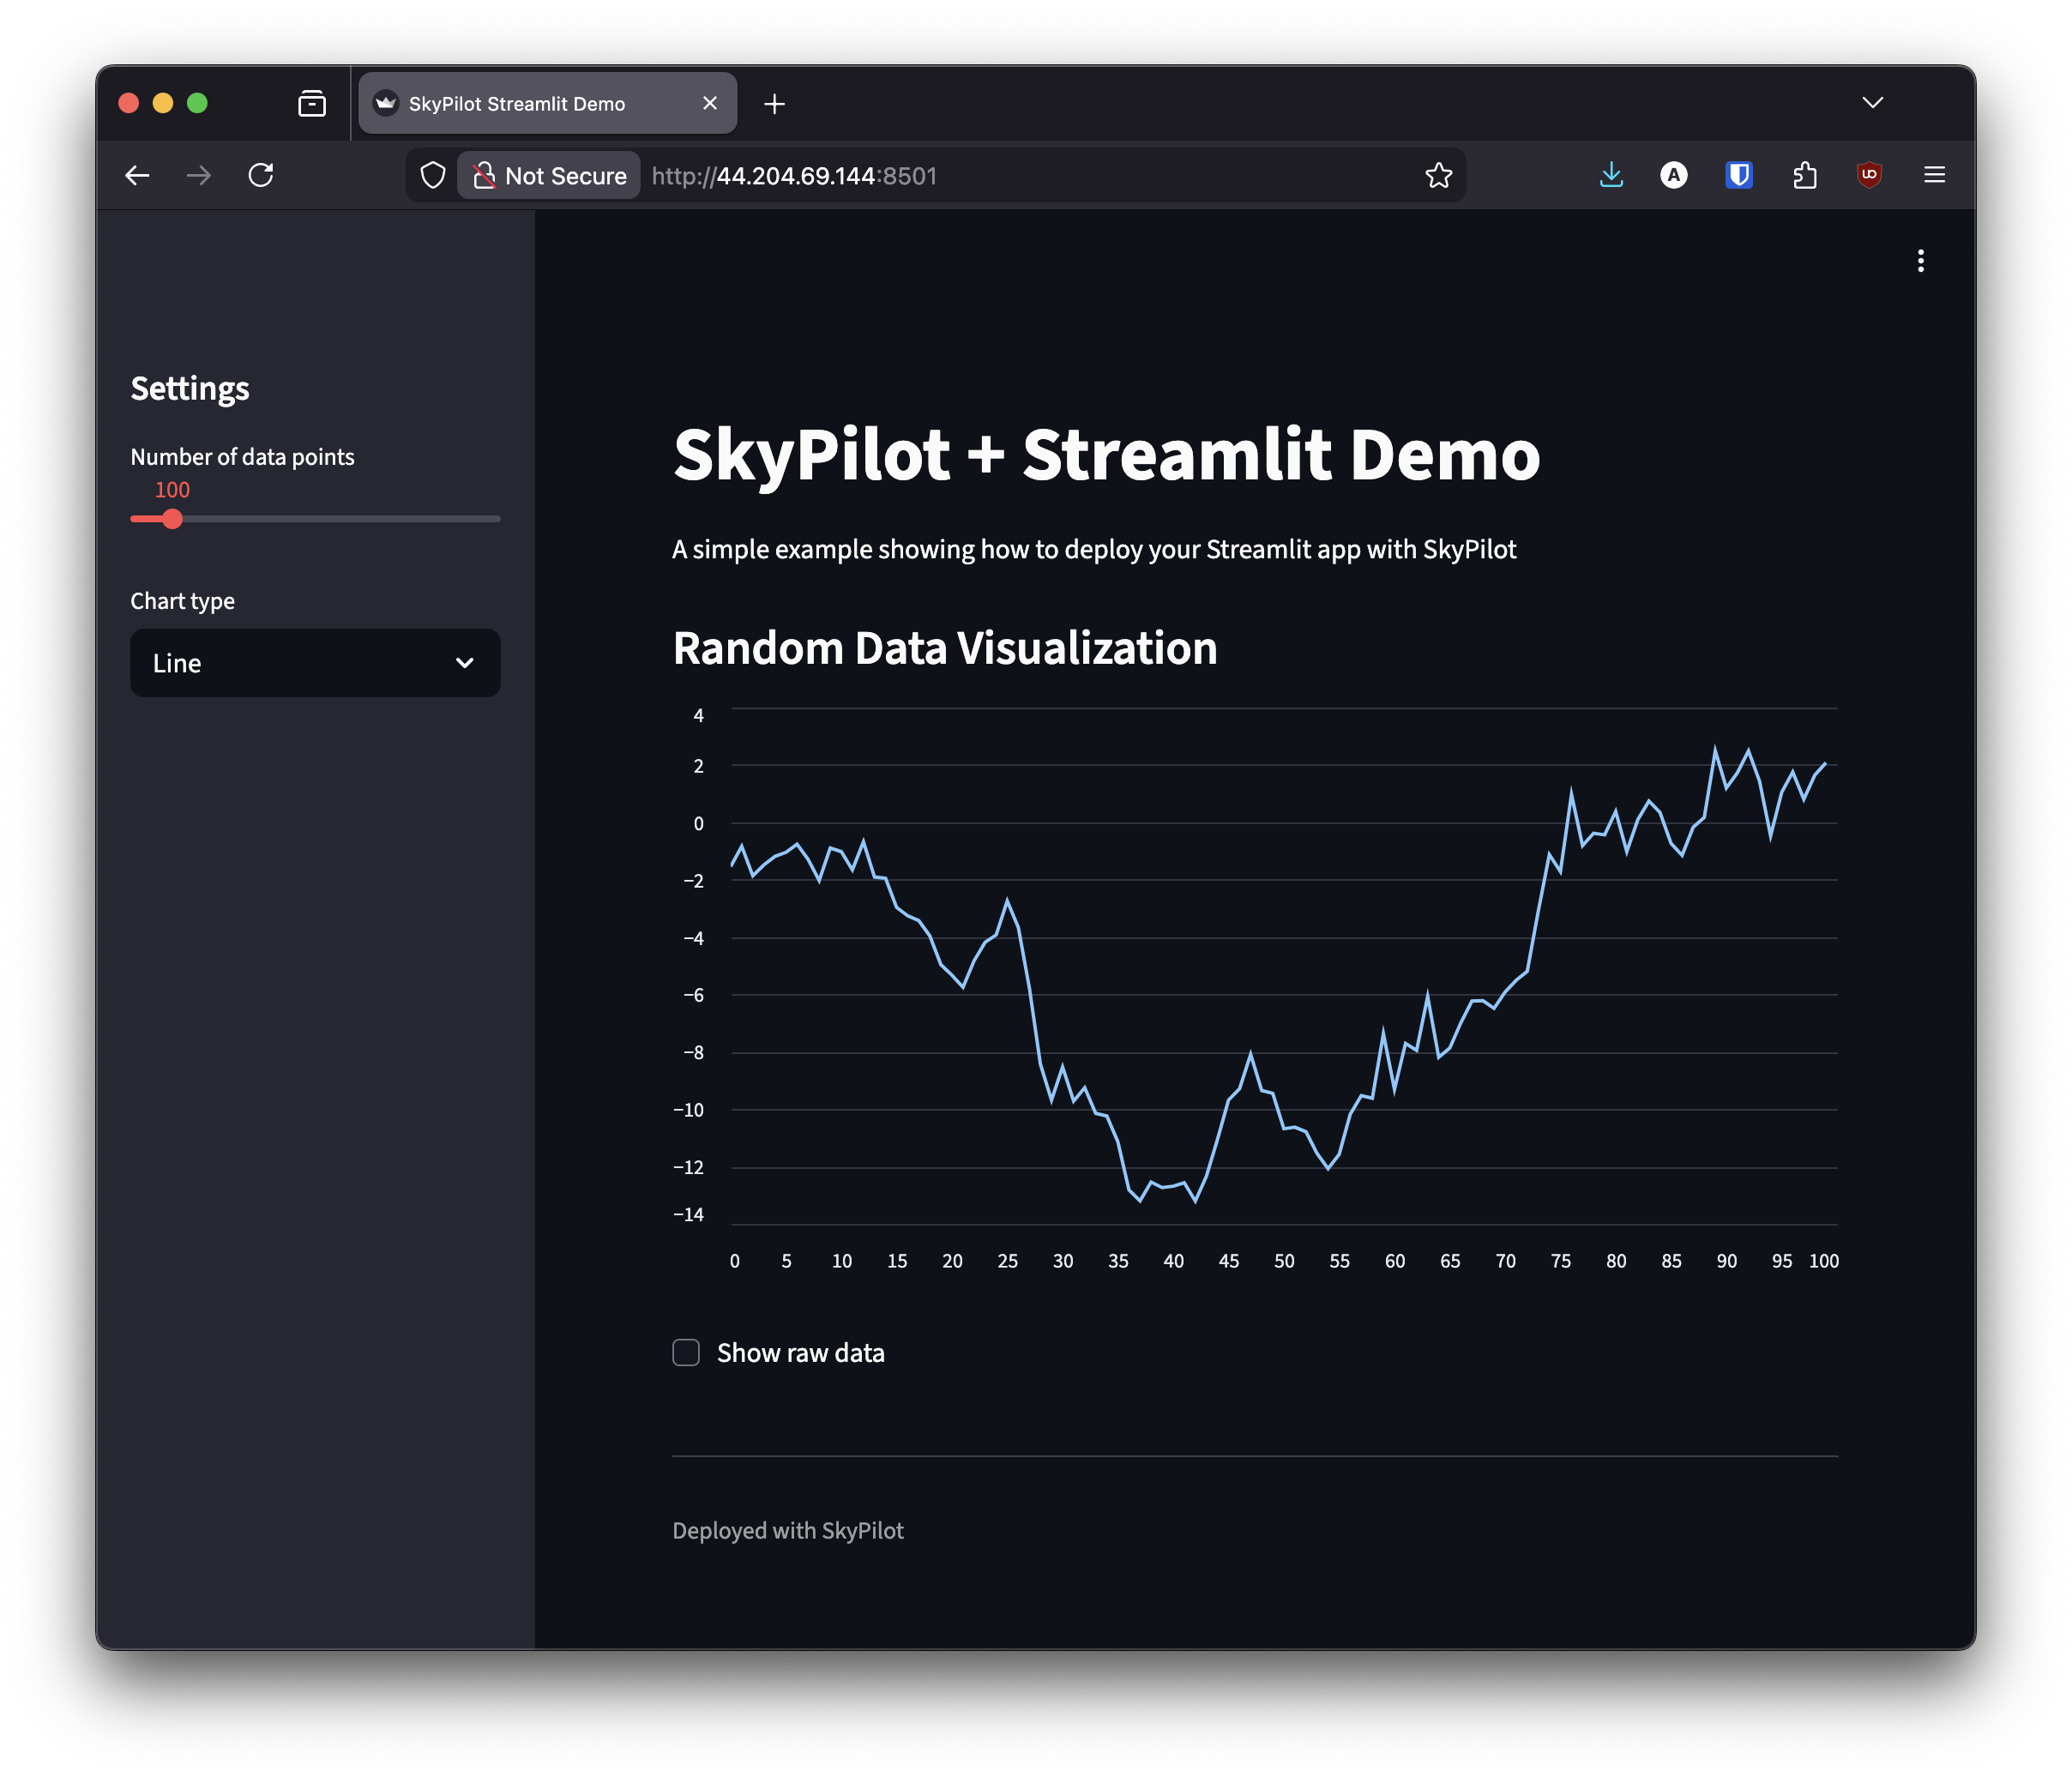
Open the URL in your browser to access your app.
Using your own Streamlit app#
Replace
app.pywith your own Streamlit applicationUpdate
streamlit.sky.yaml:Add any dependencies to the
setupsectionModify the
runcommand if your app has a different filename
Launch:
sky launch -c my-app streamlit.sky.yaml
Example with requirements.txt#
If your app needs additional packages, update the YAML:
setup: |
  pip install streamlit
  pip install -r requirements.txt
Teardown#
Stop the cluster when done:
sky down streamlit-app
Advanced options#
Custom port#
resources:
  ports: 8080

run: |
  streamlit run app.py --server.port 8080 --server.address 0.0.0.0
Specific cloud/instance#
resources:
  infra: aws # or "infra: aws/us-east-1" or "infra: gcp" or "infra: azure" etc.
  instance_type: t3.medium
  ports: 8501
Files#
app.py- Simple Streamlit demo applicationstreamlit.sky.yaml- SkyPilot task configuration
Learn more#
Included files#
"""Simple Streamlit app example for SkyPilot deployment."""
import numpy as np
import pandas as pd
import streamlit as st

st.set_page_config(page_title="SkyPilot Streamlit Demo", layout="wide")

st.title("SkyPilot + Streamlit Demo")
st.write(
    "A simple example showing how to deploy your Streamlit app with SkyPilot")

with st.sidebar:
    st.header("Settings")
    num_points = st.slider("Number of data points", 10, 1000, 100)
    chart_type = st.selectbox("Chart type", ["Line", "Bar", "Area"])

st.subheader("Random Data Visualization")
data = pd.DataFrame({
    'x': range(num_points),
    'y': np.random.randn(num_points).cumsum()
})

if chart_type == "Line":
    st.line_chart(data.set_index('x'))
elif chart_type == "Bar":
    st.bar_chart(data.set_index('x'))
else:
    st.area_chart(data.set_index('x'))

if st.checkbox("Show raw data"):
    st.dataframe(data)

st.divider()
st.caption("Deployed with SkyPilot")
streamlit.sky.yaml
name: streamlit-app

resources:
  ports: 8501

workdir: .

setup: |
  pip install streamlit

run: |
  streamlit run app.py --server.port 8501 --server.address 0.0.0.0 --server.headless true